
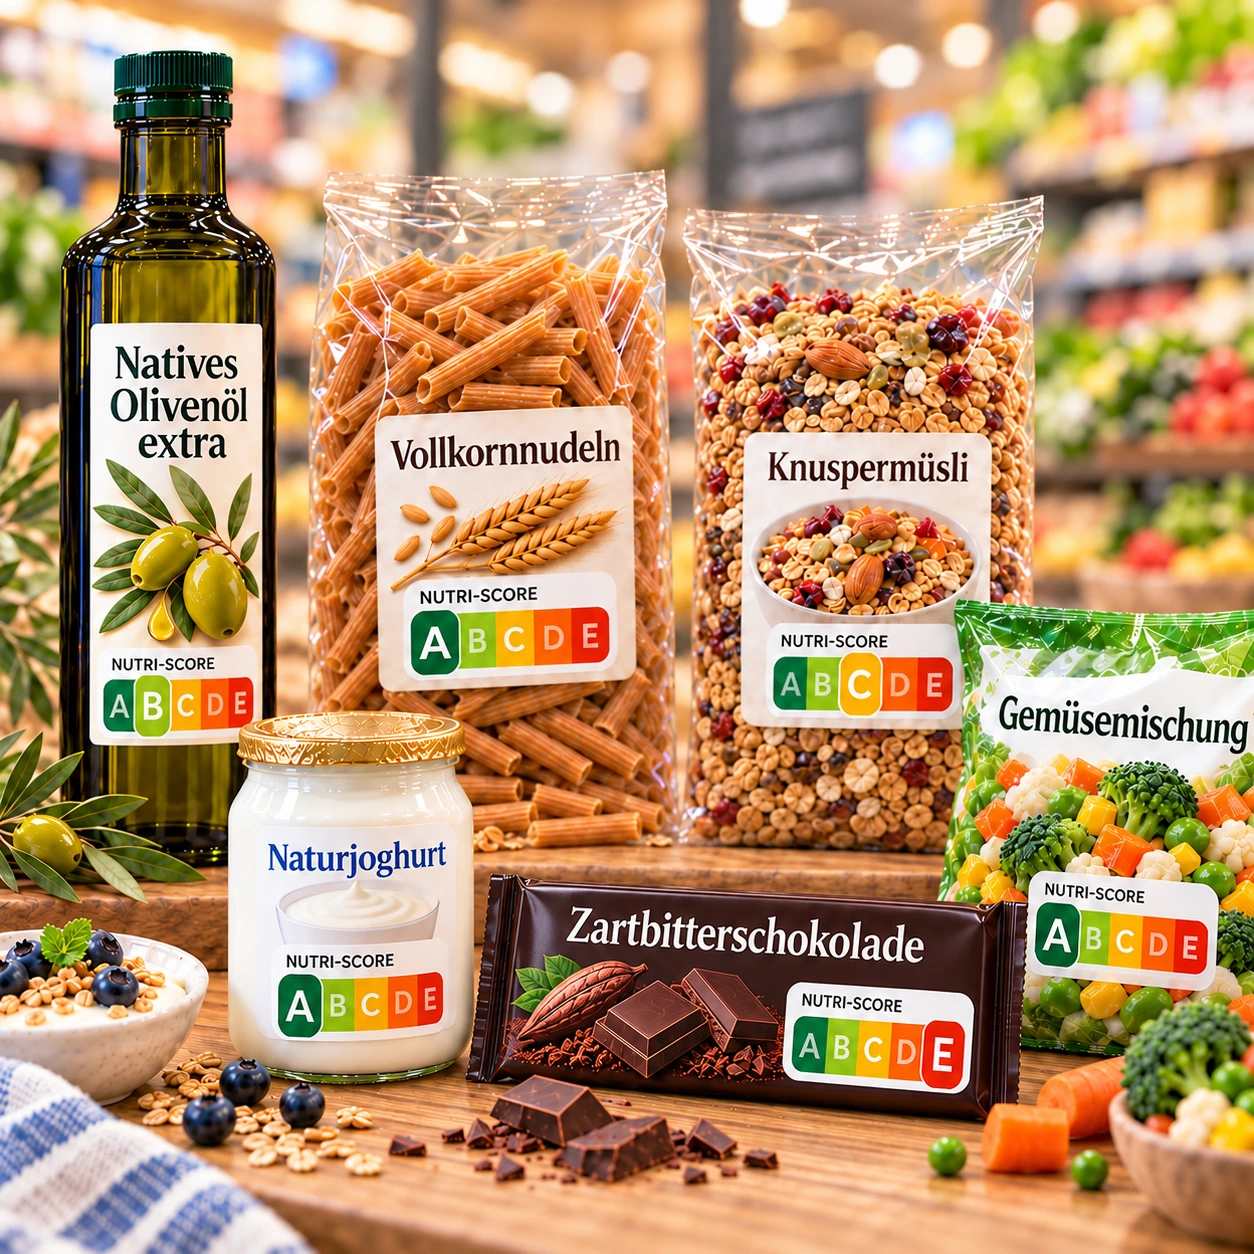
A green ‘A’ on the packaging, next to a similar product with a yellow ‘C’. Which one ends up in the shopping trolley? The Nutri-Score system is designed to make precisely these kinds of decisions easier. Five letters and a colour scale ranging from green to red serve as a guide. But how meaningful is this rating actually? And what do the letters stand for? Because as simple as the system may seem at first glance, the calculation behind it is complex.
The Nutri-Score was developed in France and introduced there in 2017. Germany followed suit in 2020. Since then, manufacturers have been able to print the label on the front of packaged food products on a voluntary basis; it is not mandatory.
The Nutri-Score is regularly reviewed and refined through scientific research. The revision of the calculation algorithm, due to be completed in 2023, is intended to bring the ratings more closely into line with current dietary recommendations.
More than 400,000 products under the microscope
Scientists have now investigated how well this works, analysing 408,399 products from 14 European countries. Factors taken into account included energy content, sugar, saturated fats and salt, as well as protein, fibre and the proportions of fruit, vegetables and pulses.
Overall, the results speak in favour of the revised algorithm: the ratings were largely consistent across the different countries. Frozen fruit and vegetables, as well as pulses, were predominantly rated A or B, whilst chocolate and sweet pastries were mostly rated D or E.
There are still outliers, however
Even the revised Nutri-Score is not entirely free of outliers. In the case of wholemeal pasta or rice, for example, the researchers still see room for improvement. Drinks containing sweeteners fare worse under the new algorithm: they receive additional penalty points and can therefore slip from a B to a C, for instance.
Overall, the revised Nutri-Score therefore performs better than its predecessor. However, some individual weaknesses remain.
But what about everyday shopping? Do consumers really understand what the letters mean? Does the Nutri-Score influence their purchasing decisions? And where does the system reach its limits?
That is what the next articles will explore.